This blog post offers an insight into the features and functionalities of Google Data Studio and compares it with popular data analysis tools like Tableau, QlikView and new entrants like Power BI.
Disclaimer: This article and all features assessed are as on Sep, 2017 and subject to modifications / enhancements by Google.
Timeline
March 2016: Google announced the launch of a new group of analytics products - the Google Analytics 360 Suite. Included in the launch was Google Data Studio, a new data visualization and reporting tool.
June 2016: Google’s new data analysis and visualization platform is available in the US. It allows users to quickly access data, visualize reports, and share across the organization. All US users can create 5 reports and unlimited data sources.
February 2, 2017: Google removed the 5-report limit: users can now create as many reports and data sources as needed in the free version of Data Studio.
March 7, 2017: Data Studio is widely available (in over 180 countries).
September 2017: Data Studio allows users to connect data from databases like Google Cloud SQL, MySQL, Postgres SQL and to build their own connectors in addition to Google Sheets, Google Analytics and Analytics 360, AdWords, DoubleClick, and YouTube channels.
Report sharing and collaboration process was enhanced with support for embedding public or private reports in websites, blogs, and other web properties that support the iframe HTML tag.
The continuous evolution of Data Studio as a tool backed by Google makes it one of the top contenders in BI space.
So, is this just another data analysis tool? What is the value proposition offered by Data Studio?
We have many other widely used BI tools like Tableau, QlikView, Power BI, OBIEE etc., that offer easy-to-use, self-service capabilities for data visualization. What makes Google Data Studio stand out from the crowd?
Let’s look at some of the features and functionalities of data studio in detail. What's under the hood?
1. Visualizations
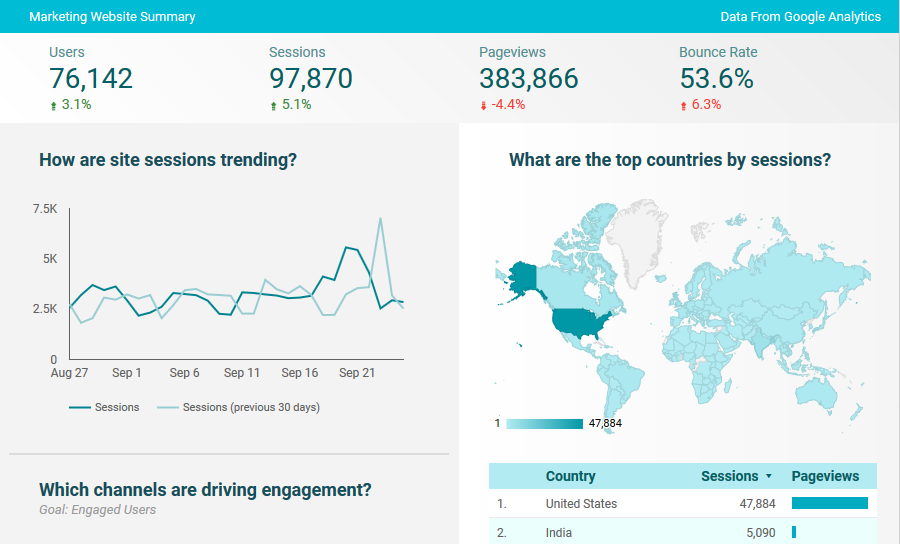
Google Data Studio turns your data into informative dashboards and reports that are easy to read, easy to share, and fully customizable. Dashboards allow your data to tell stories and support better business decisions.
Data Studio offers a wide variety of frequently used data visualizations that any other BI tool offers. However, unlike Tableau or OBIEE, based on chart selection, dimensions and metrics that are fit for the selected visualization will be automatically selected for reporting.
Graphs like histograms and heat maps are not available as a standard like in Tableau and can be customized like in QlikView or Power BI.
By default, Google Data Studio has a wide variety of sample templates that are suitable for different business functions. These sample templates meet most business requirements with enough room for enhancements.
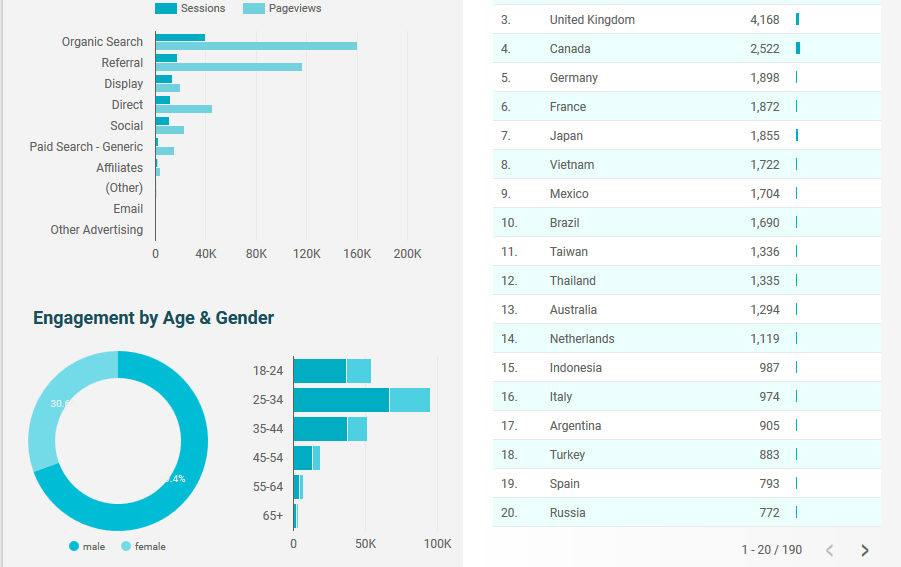
It is possible to modify an existing data visualization type to some extent, such as making a pie chart look like a doughnut, but Google Data Studio is not as flexible as Tableau, QlikView or Power BI.
a. Calculated Metrics
All BI tools such as Data Studio, Tableau, OBIEE, Power BI etc. offer the standard aggregation functions, such as average, count, maximum, minimum, sum, and count distinct.
Data Studio offers 53 functions including aggregations, arithmetic, date, geo, text and other functions.
Tableau offers number, text, date, type conversion, logical, aggregate, user, and other functions, as well as table calculations. For instance, Tableau offers over 150 functions.
b. Drag & Drop Analytics
Google Data Studio doesn't offer any drag and drop analytics features for application to an existing chart. It automatically selects the dimensions and metrics, based on the type of chart the user picks on the toolbar. However, most BI tools have this drag and drop feature for metrics and dimensions which is quite useful.
2. Pricing
Google Data Studio is free. Previously, users were allowed to create only 5 free reports, but Google has removed this limitation.
On the other hand, Tableau Public is a limited version of Tableau and is available for free with limitations on the data sources connectors (csv, Excel, Google Sheets, and OData) and all your data will be public. Tableau Desktop and Server licenses are meant for Professional and Enterprise use and come with a price tag.
Power BI Desktop is the free version and allows you to connect to many data sources with no enterprise distribution and collaboration capabilities. Power BI Pro on other hand with a price tag adds up all these additional capabilities.
https://powerbi.microsoft.com/en-us/documentation/powerbi-free-vs-pro/
3. Web-based Tool vs. Desktop Tool
Data Studio 360 is a web-based tool; it is only available via the browser. After connecting to the data source, report building, sharing etc. can be done through browser, without any cumbersome client-server architecture. The quality of your internet connection may affect your experience with the tool.
On the other hand Tableau, Power BI and QlikView offer desktop client tool to develop content in offline mode and can publish to servers.
OBIEE metadata can be prepared offline but report/dashboard creation has to be happen in the browser similar to Data Studio.
4. Data Connectors
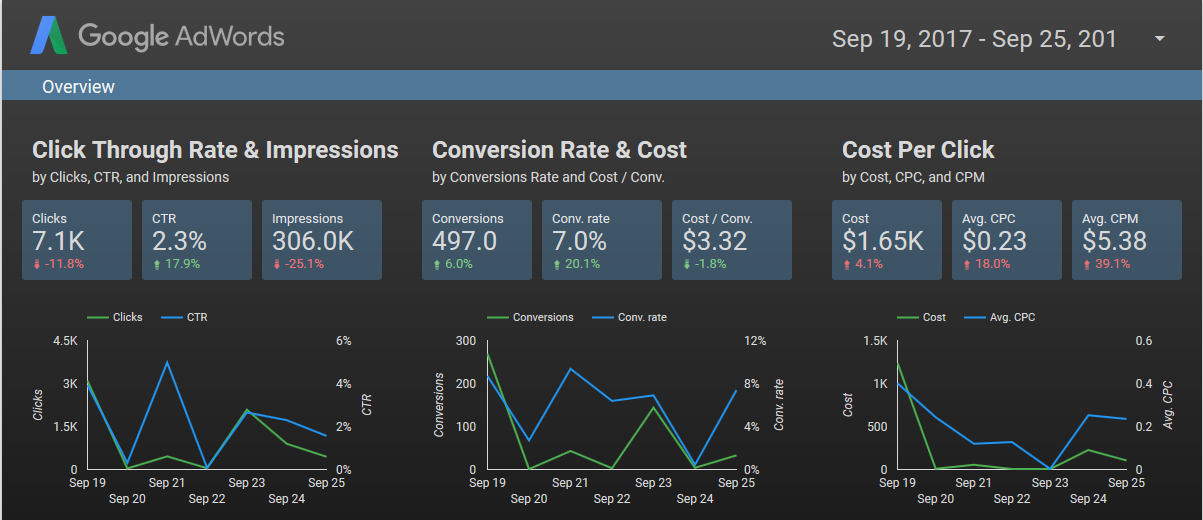
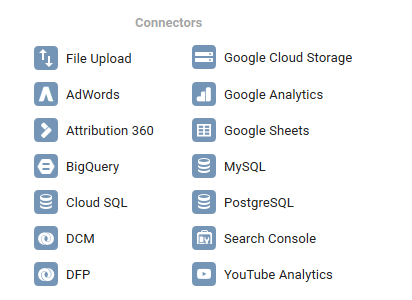
Connectors are the biggest differentiator. Data Studio 360 offers connectivity to Google’s data sources that include AdWords API, Attribution 360, BigQuery, DoubleClick Campaign Manager, Google Analytics, Google Sheets, and YouTube Analytics. It has also released a connector to the Postgres and MySQL database. Obviously, the list of Data Studio’s native connectors is quite limited – so you are looking at getting your data into Google Sheets, Google BigQuery, or Cloud SQL first.
Interestingly you can build your own connectors with latest release update. Community Connectors are community developed connectors that enable access to a variety of data sources directly from within Data Studio.
A Glance at Data Studio Native Data Source Connectivity
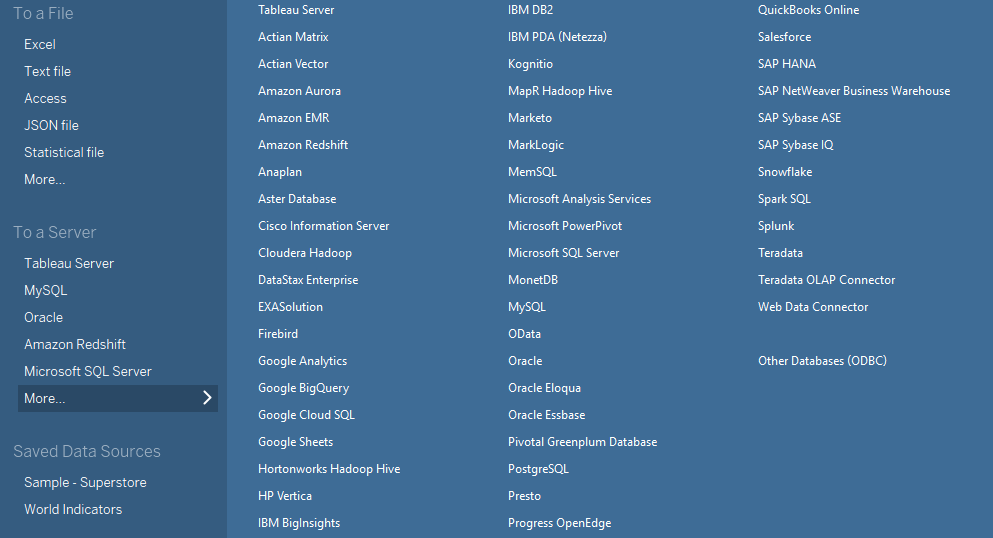
On the other hand, Tableau, Power BI opens connectivity options to numerous data sources including Google’s products such as Google Analytics, Google BigQuery, Google Cloud SQL and Google Sheets.
Tableau does not offer access to other Google’s products, such as AdWords, Attribution, or YouTube Analytics, but you can get an access to these via third party tools.
A Glance at Tableau Native Data Source Connectivity
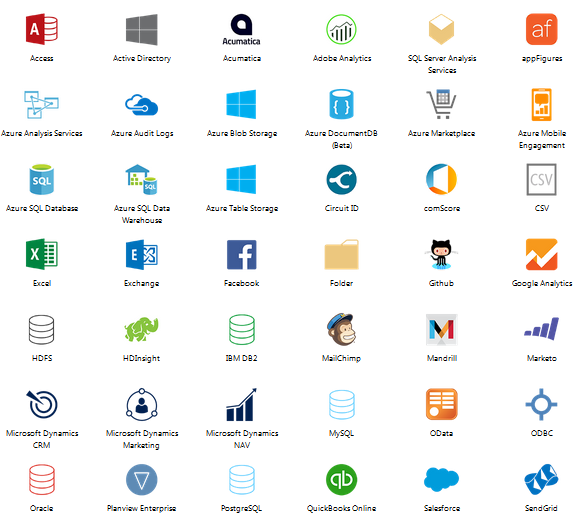
A Glance at Power BI Native Data Source Connectivity
5. Working with Data at Source – Metadata Management
a. Joins
Data Studio does not provide data joining capabilities. Datasets have to be built outside Data Studio and then brought in for visualization.
Tableau, OBIEE and Power BI have data-joining capabilities that include inner, left, right, and full outer joins. It is possible to join multiple data sources and use the resulting data in Tableau visualizations.
b. Reporting – Multiple Data Sources
Sometimes you don't want to join or blend data - all you want is a single dashboard that includes charts that come from very different data sources. For example, you may want to include revenue, cost, sales, and warehouse stocks related charts built on different data sources in one dashboard.
In Tableau, OBIEE and Power BI, you can create reports using different subject areas or data sources and then place them in a single dashboard. Data Studio also provides the functionality.
c. Data Preparation
Data Studio 360 also offers the data preparation feature - we can change the aggregation rule, disable the columns, create custom field, rename etc. at the moment.
OBIEE and Tableau offer various ways to prepare data for visualization. For example, you can hide columns, create groups of columns, split columns, pivot columns, and apply filters at source.
6. Sharing and Collaboration
a. Sharing
Data Studio is built with the same technology that underlies popular GSuite products like Docs, Sheets, and Slides which means you get to decide who gets access to your reports. Grant individuals or groups, inside and outside your company, the right to edit or view with just a few clicks. Real-time collaboration allows multiple teammates to edit a single report at the same time. We cannot Schedule reports at the moment in Google Data Studio.
Though most of the BI tools have impressive capabilities in empowering the user to share visualizations. But none of them provide much in the way of collaborative work and collaborative editing of the workbook while still in development as Google Data Studio offers.
b. Access Control
Similar to Google Drive, Data Studio offers multiple levels of access: viewer, editor, and owner. It is possible to grant access to a specific report or to a folder that contains multiple reports. You can share your reports by manually adding a collaborator's email address, or via a link, and with individual collaborators or a group of collaborators. It is also possible to make the report public on the web.
c. Security
Data Studio uses Google's authentication protocol and data security. It isn't possible to restrict the data based on the row and column level security at the moment as OBIEE/ Tableau does its job in robust way.
d. Mobile and Tablet Access
Google Data Studio has responsive design and adjusts automatically. It isn't possible to manually set how the dashboard will look across devices.
Currently no mobile / tablet app is available for Android or iOS.
Tableau, OBIEE or Power BI offers a Device Preview feature that lets the user customize how the dashboard will look on various devices, including mobiles and Tablets. It is possible to set it to automatically adjust to the device screen size. It is also possible to manually set how the dashboard will look across devices
Tableau Mobile, Oracle BI Mobile and Power BI Android and iOS apps are available for better device visualization experience with limited content editing capabilities.
7. Support and Documentation
Data Studio offers some documentation support and has a Google+ community page, with fairly limited content while well-established visualization tools like Tableau, OBIEE and Power BI has extensive documentation and support forums and blogs.
Conclusion
Google Data Studio fits well if all your data is already within the Google ecosystem or MySQL and Postgres DB as these are currently supported connectors. Buckle-up to host your data in to supported platforms at the moment to explore google studio reporting capabilities.
Hopefully Google will get ODBC and JDBC driver and other big data platform connectivity in the near future.
Google Data Studio’s sharing functionality, price, and ease of report building is a plus point but has room for many more enhancements that conventional reporting tools offers in terms of data security needs (Object & Data Level Security), data modelling, Scheduling/Alerts for reports, complex enterprise reporting needs (OBIEE) , Version Control, insights of queries and their performances etc.
Getting started with Google Data Studio? Click here.
References
- https://support.google.com/datastudio/?hl=en#topic=6267740
- https://cloud.google.com/data-studio/
- https://www.en.advertisercommunity.com/t5/Data-Studio/bd-p/Data-Studio
Disclaimer: All features and capabilities mentioned above are as on Sep, 2017 and subject to modifications / enhancements by Google.
 |
Rushendra is a Lead Consultant at KPI Partners' Offshore Technology Center. He is a certified Tableau Desktop Associate with expertise in OBIEE and several modules of Oracle BI Applications. He has also worked on various Salesforce integration and analytics projects and has hands-on experience in Hyperion, QlikView and Power BI. |