by Kurt Wolff
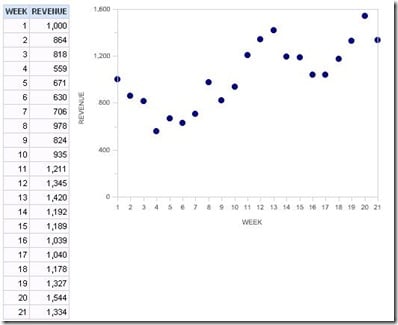
Linear regression is a statistical technique for drawing a line through a set of data points that “best fits” the data. It is a useful and standard technique for quantifying trends.
Linear regression is a statistical technique for drawing a line through a set of data points that “best fits” the data. It is a useful and standard technique for quantifying trends.
Tags: Kurt Wolff, Oracle BI, Blog
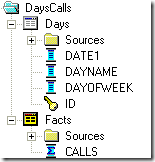
One of the questions that comes up over and over again is how to show all periods in a query when facts don’t exist for all periods or how to show all products when facts don’t exist for all products.
Tags: Kurt Wolff, Oracle BI, Blog
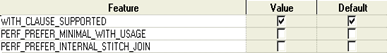
If you’re not concerned about database portability – for example, you use Oracle and that’s that, forever – then the evaluate function in OBIEE can be useful. However, using the evaluate function can be tricky, and the documentation could be better.
Tags: Kurt Wolff, Oracle BI, Blog
[Note: the following discussion is based on OBIEE version 10.1.3.4.0 and Oracle XE version 10G, both running on Windows. The behavior of other versions of OBIEE could be different.]
Tags: Kurt Wolff, Oracle BI, Blog
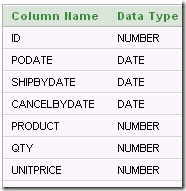
Common practice is to use derived tables (sometimes referred to as “inline views”) when creating a physical layer “Select” table.
Tags: Kurt Wolff, Oracle BI, Blog
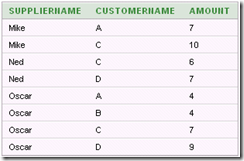
Here’s a not uncommon scenario. You are designing a dashboard page with a report such as sales by customer. To show sales by customer, you design a report containing the CustomerName column so that facts are grouped by customer. You provide a multi-select prompt to allow the user to select which customer data to view. But you also want to provide the ability to view the data for all customers as a total, without grouping by customer.
Tags: Kurt Wolff, Oracle BI, Blog
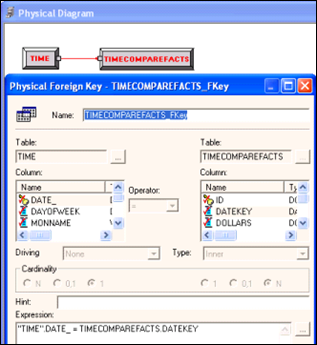
Here is a technique for enabling the user to set join columns with a dashboard prompt.
Tags: Kurt Wolff, Oracle BI, Blog
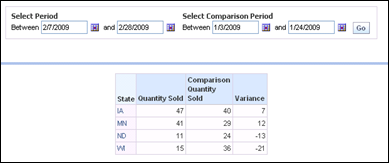
The Ago() “time series function” can be used to show data for a previous time period, as long as the previous time period corresponds to a level that has been defined in the period hierarchy. A typical period hierarchy containing day, month, quarter, and year levels would allow you to use the Ago function to construct measures showing data for day ago, month ago, quarter ago, year ago (or N days ago, N months ago, etc.).
Tags: Kurt Wolff, Oracle BI, Blog
Someone asked a question on a “Siebel Analytics” email group a few days ago that I thought was worth discussing briefly here. The question posed was how to put a date prompt on a dashboard and return data for that date and the next 30 days. The solution could not involve presentation or report variables, since these were introduced only in a later version of Siebel Analytics that the person who posed the question did not have.
Tags: Kurt Wolff, Oracle BI, Blog
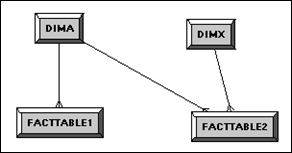
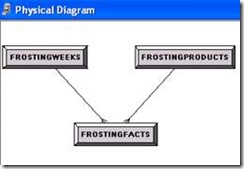
When I read the questions people ask about data modeling on OBIEE forums, one that seems to come up frequently is what to do when you have fact tables that do not join to all dimension tables.
Tags: Kurt Wolff, Oracle BI, Blog