by Chandra Matam
Azure Analysis Services with Power BI - Best Practices
Power BI Overview
Power BI is a business analytics solution that lets you visualize your data and share insights across your organization or embed them in your app or website. Connect to a wide variety of data sources and bring your data to life with live dashboards and reports.
Power BI connects to a large number of varied data sources, including:
- Online services like Salesforce, Dynamics 365, etc.
- Databases like SQL Server, Access, Amazon Redshift, etc.
- Simple files like Excel, JSON, etc.
- Other data sources like Spark, Web sites, Microsoft Exchange, etc.
Power BI works in three modes to connect to on-premise or cloud-based sources.
Modes of Connectivity
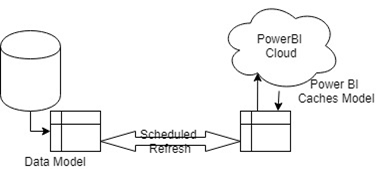
Import data
- Imports data into Power BI cache.
- Data set size is limited to less than 1 GB (Premium capacity allows bigger data sets)
- Useful when the data set is not changing frequently or changing overnight or a period
- Allows you to refresh the imported data at specified intervals.
- Gives the best performance in this mode with its fully optimized query engine and data exists in the cache.
- Allows to get data from multiple sources
For small setups with few data models, data imports into Power BI will solve reporting requirements. However, for enterprises with TBs of historical data and GB's daily incremental data, the import will lead to data governance issues like:
- Performance issues
- Multiple models maintenance
- Data redundancy
- Single source of truth
Direct Query
- Let's you connect to the data source directly
- Performance of the model depends on the underlying data source
- Helps to achieve real-time, near real-time data loads
- Allows to get data from a single source only
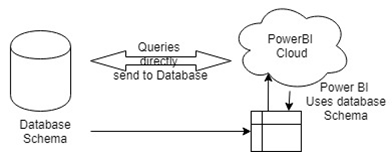
- Direct query option suitable for small/simple workloads
- This mode results in performance issues when
- Underlying data source size is huge
- Data is not cleansed
- Not modeled as per reporting requirements
Live Connection
With Import and DirectQuery modes, we have observed limitations in terms of import data size and performance dependency on source systems.
The difference between Live and direct query is:
In Live Mode, Power BI doesn't make a copy of data in cache nor does it make a copy of schema / allow data modeling in Power BI design. Instead, it consumes source as is, i.e., Power BI is just the front end for your reporting.
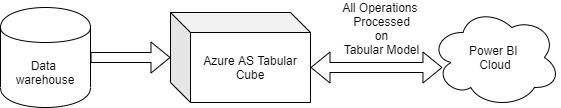
Live Mode overcomes all scalability and performance issues by connecting to a Tabular cube defined on Azure Analysis Services OR On-Premise SQL Server Analysis Services.
To Connect to on-premise or Azure Analysis Services Tabular cube
- In Power BI Desktop, click Get Data> Azure > Azure Analysis Services database.
- In Server, enter the server name. Be sure to include the full URL; for example, asazure://westcentralus.asazure.windows.net/advworks .
- In Database, if you know the name of the tabular model database or perspective you want to connect to, paste it here. Otherwise, you can leave this field blank and select a database or perspective later.
- Select a connection option and then press Connect.
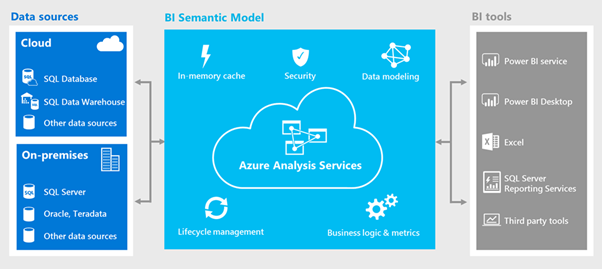
How is the Azure Analysis Services Cube Live connection better than Direct Query Mode?
Analysis Services Tabular cube comes with the below advantages.
- Analysis Services Tabular cubes can be defined on top of relational databases free form aggregated tables OR on top of Dimensional data model
- Data can be a blend of different data sources
- Most complex Calculations required in dashboards can be created using powerful DAX expressions.
- Multi-level attribute hierarchies can be defined so that all related measures pre-aggregated.
- When Azure AS/SSAS Tabular Cube (in Import mode) is processed, data gets pre-aggregated and stored in Columnar, compressed format. It provides data compression up to 1:10.
- Azure AS/ SSAS cubes deployed in-memory This gives great performance boost even when underlying data reaches a few billion records or >5 Terabytes of data.
- As the Data model(s) consumed in PowerBI are part of a single visual studio solution, the model is safe in terms of
- Controlling multiple versions
- Maintaining code
- Achieve a single version of truth by implementing conformed dimensions
- Azure AS supports scaling up/down, Pause/Resume resources as per usage.
- Azure takes care SW upgrades and patching
- Unlike Power BI dataset size limitations, Tabular cube size is only limited by azure AS capacity
- Power BI allows you to refresh data sets eight times a day (in Pro license) and 42 times in Premium capacity. However, Azure AS/SSAS does not have any such restrictions.
- Azure AS allows scalable partitioning of big tables and allows data to refresh at the object level. Instead of refreshing full tables every time, only selected partitions can be processed by saving time and resources.
- A Semantic layer like Azure AS is very important to support enterprise business groups who don't want to have their own data wrangling, integration and modeling activities
practices using SSAS Tabular
Data Model Design
Cube size Focus on Data model design to minimize volume and size. As we learned Azure AS /SSAS vertipaq engine stores data in columnar format, it is advised to minimize the column dictionary by reducing the unique values in aggregated tables. If we include a fact table (10+mln records) with a surrogate key column, it creates a columnar dictionary of 10+mln records. However, the surrogate key is not actually used in PowerBI reporting.
Remove all ETL columns For ETL maintenance, certain date and datetime columns, Surrogate keys often used in DWH development, which are not necessary for reporting. Hence, stop using the same in the data model and avoid high volume data dictionary.
Are all columns relevant take conscious decisions to include only necessary columns for reporting. Pull only selected columns that are the most relevant and are needed for the reporting. Instead of pulling the entire table and hiding which are not required for reporting, import only required columns and avoid wide tables.
Partition your facts Azure AS/SSAS allows you to partition fact tables, improving cube performance. In most cases, the current period (day/week/month/quarter) only gets updates, so it is advised to create the right partition and minimize overall cube processing time by process relevant partitions. This will certainly allow multiple processing windows and the availability of the latest data in the reporting layer.
While Designing Azure AS/SSAS cubes, use business-friendly names for tables/columns/calculations because the same will be visible when PowerBI reports are designed.
Hide all columns in the tables that are not intended for reporting like the Key columns, Base Measure columns and any other metadata-related columns.
Use a standard Date Dimension defined in the Data Warehouse or DataMart as the date dimension source.
Mark the Date Dimension as such to Enable Time Intelligence in the Tabular cube.
Calculated Columns and Measures
Calculations By limiting complex calculations to Azure AS/SSAS cube, it encapsulates business logic and ensures a single version across all users. However, more calculations in the cube occupy more memory and eventually slows down performance. To mitigate this, plan to add calculations in the Import query OR include it in the dimensional model population.
Optimize expressions Use tools like DAX studio to analyze execution plan and cost analysis of Data Analysis Expressions used in calculations.
Use inexpensive functions - ADDCOLUMNS instead of SUMMARIZE or COUNTROWS instead of DISTINCTCOUNT.
Try to implement Vertipaq complaint code rewrite nested functions, so that it is resolved as a single function.
Filter unused rows - make sure to remove empty rows or the rows that are not required before an expensive computation to minimize the overall dataset and improve the performance.
Hardware Considerations
For a memory-intensive application like Azure AS/SSAS Tabular, it is important to do a quality due diligence considering various factors, few mentioned below
CPU Speed: Faster CPU speed helps in computing results faster.
CPU Cores: Address concurrency issues by increasing CPU cores while striking a balance between CPU speed and cores.
CPU Cache: as retrieving data from the CPU cache is much faster than retrieving data from RAM, plan it more.
RAM size: Make sure RAM size is more than two times the cube size.
RAM Speed: For a memory-intensive application like Azure AS/SSAS Tabular, faster the RAM speed, the better is the performance.
General
Consider switching off Or minimize the interaction between visuals, which reduces the query load when users cross-highlight.
Limit the number of visuals and the data per visuals.
Enabling row-level security can result in large changes in performance. Be sure to test the different row-level security roles that your users will assume.
Visuals pinned to dashboards are served by the query cache when the dashboard loads. Conversely, when visiting a report, the queries are made on-the-fly to the data source either the Power BI service (in the case of import) or the data source that you specify (in the case of DirectQuery or live connection).
Chandra Matam is a Sr Technical Manager at KPI Partners and has around 15+ years of experience in data warehousing, governance, modelling and designing business intelligence applications. He has extensively worked on Microsoft BI, PowerBI and Azure data projects using Azure data factory, Azure databricks, azure SQL DWH. He is working on developing optimized real-time ETL processes using spark,python