


by Balaswamy Kaladi
This blog describes how to configure Informatica’s SAP NetWeaver R/3 to connect with SAP BW, extracting data directly...

by Balaswamy Kaladi
This blog describes how to configure Informatica’s SAP NetWeaver R/3 to connect with SAP BW, extracting data directly from SAP transparent tables. It details setup steps on Informatica and BW servers, as well as what’s required from a developer’s perspective.
It’s also important to note that there are two ways to connect SAP BW from Informatica, i.e.
- Using Informatica’s SAP BW Connector – this extraction is driven by an Infospoke and extracts data via the Open Hub Services (OHS)
- Using Informatica’s SAP NetWeaver R/3 Connector – this allows data extraction directly from a SAP transparent table
This blog details the second method i.e. using Informatica's SAP NetWeaver R/3 Connector.

by Balaswamy Kaladi
In today’s world of big data, analytics, and data warehousing, data volumes continue to grow, seemingly only matched...
by Balaswamy Kaladi
In today’s world of big data, analytics, and data warehousing, data volumes continue to grow, seemingly only matched by businesses’ appetite to exploit data for commercial advantage, and do so ever more quickly.
Historically, to deal with the kind of large data volumes that are now becoming commonplace, expensive and heavyweight technologies from vendors such as Teradata, Netezza and Vertica were needed. These typically cost millions of dollars, and required hardware, software, and consulting.

by Santoshkumar Lakkanagaon
What are the different types of Cassandra distributions available?
- Open Source Apache Cassandra (GitHub)
- DataStax Community Edition (free for development and production)
- DataStax Enterprise with OpsCenter, DevCenter and Drivers (free for development and license required for production)
by Ron Cruz
Thinking of moving to a cloud based data warehouse platform? Here’s what you need to evaluate and learn how to do it.
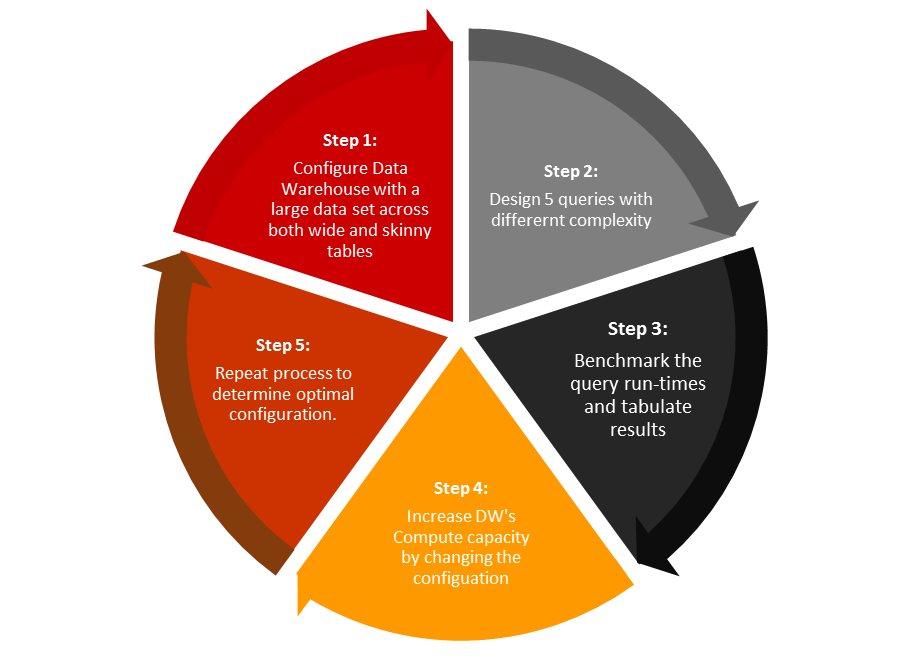
by Ron Cruz
Thinking of moving to a cloud based data warehouse platform? Here’s what you need to evaluate and learn how to do it.

by Santoshkumar Lakkanagaon
Modern Big Data requirements include:
- Multi-region availability
- Fast and reliable response
- No single point of...
by Santoshkumar Lakkanagaon
Modern Big Data requirements include:
- Multi-region availability
- Fast and reliable response
- No single point of failure
- Scalability
Traditional relational databases (RDBMS) are not enough to meet these requirements because the relational model provides normalized schema, table joins and ACID compliance which causes a massive overhead for big data. In order to support these features, we need high-end systems which are not cost effective. Additionally, such systems often require substantial downtime.

by Jeremiah Johnson
Data scientists are master communicators. They speak fluently with people in operations areas and those in information...
by Jeremiah Johnson
Data scientists are master communicators. They speak fluently with people in operations areas and those in information technology departments. They understand technical jargon, business lingo and are information experts. Unlike a jack-of-all-trades, who knows a lot but masters nothing, data scientists know plenty and often are experts in many fields. Most importantly, they find solutions for business problems.
by Ron Cruz
Business Intelligence has changed. There are new disruptive technologies, the cloud, and a paradigm shift that is putting more...
by Ron Cruz
Business Intelligence has changed. There are new disruptive technologies, the cloud, and a paradigm shift that is putting more power into the hands of users instead of IT. More competition has allowed companies that have never had a chance to get into business intelligence to enter into the world of BI. Competition has also lead to more functionality to make true the promise of Business Intelligence.

by Parul Singh
Teaching is a complex, multifaceted activity that often requires the instructors to juggle between multiple tasks and goals...
by Parul Singh
Teaching is a complex, multifaceted activity that often requires the instructors to juggle between multiple tasks and goals simultaneously. The following are the small but powerful set of metrics that can interpret workloads and instructor assignments to make a better decision for effective and efficient instructor planning for courses. This would also support budget, resource allocation analyses and decision-making.

by Mangesh Dange
Oracle Big Data Discovery is a set of end-to-end visual analytic capabilities that leverage the power of Hadoop to...
by Mangesh Dange
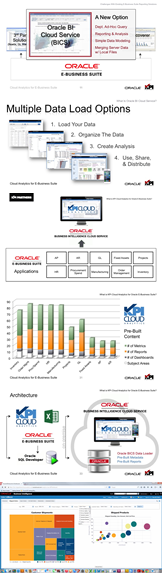
Oracle Big Data Discovery is a set of end-to-end visual analytic capabilities that leverage the power of Hadoop to transform raw data into business insight in minutes, without the need to learn complex products or rely only on highly skilled resources.


by Balaswamy Kaladi
This blog describes how to configure Informatica’s SAP NetWeaver R/3 to connect with SAP BW, extracting data directly from SAP transparent tables. It details setup steps on Informatica and BW servers, as well as what’s required from a developer’s perspective.
It’s also important to note that there are two ways to connect SAP BW from Informatica, i.e.
- Using Informatica’s SAP BW Connector – this extraction is driven by an Infospoke and extracts data via the Open Hub Services (OHS)
- Using Informatica’s SAP NetWeaver R/3 Connector – this allows data extraction directly from a SAP transparent table
This blog details the second method i.e. using Informatica's SAP NetWeaver R/3 Connector.
by Balaswamy Kaladi
In today’s world of big data, analytics, and data warehousing, data volumes continue to grow, seemingly only matched by businesses’ appetite to exploit data for commercial advantage, and do so ever more quickly.
Historically, to deal with the kind of large data volumes that are now becoming commonplace, expensive and heavyweight technologies from vendors such as Teradata, Netezza and Vertica were needed. These typically cost millions of dollars, and required hardware, software, and consulting.
by Santoshkumar Lakkanagaon
What are the different types of Cassandra distributions available?
- Open Source Apache Cassandra (GitHub)
- DataStax Community Edition (free for development and production)
- DataStax Enterprise with OpsCenter, DevCenter and Drivers (free for development and license required for production)
by Ron Cruz
Thinking of moving to a cloud based data warehouse platform? Here’s what you need to evaluate and learn how to do it.
by Santoshkumar Lakkanagaon
Modern Big Data requirements include:
- Multi-region availability
- Fast and reliable response
- No single point of failure
- Scalability
Traditional relational databases (RDBMS) are not enough to meet these requirements because the relational model provides normalized schema, table joins and ACID compliance which causes a massive overhead for big data. In order to support these features, we need high-end systems which are not cost effective. Additionally, such systems often require substantial downtime.
by Jeremiah Johnson
Data scientists are master communicators. They speak fluently with people in operations areas and those in information technology departments. They understand technical jargon, business lingo and are information experts. Unlike a jack-of-all-trades, who knows a lot but masters nothing, data scientists know plenty and often are experts in many fields. Most importantly, they find solutions for business problems.
by Ron Cruz
Business Intelligence has changed. There are new disruptive technologies, the cloud, and a paradigm shift that is putting more power into the hands of users instead of IT. More competition has allowed companies that have never had a chance to get into business intelligence to enter into the world of BI. Competition has also lead to more functionality to make true the promise of Business Intelligence.
by Parul Singh
Teaching is a complex, multifaceted activity that often requires the instructors to juggle between multiple tasks and goals simultaneously. The following are the small but powerful set of metrics that can interpret workloads and instructor assignments to make a better decision for effective and efficient instructor planning for courses. This would also support budget, resource allocation analyses and decision-making.
by Mangesh Dange
Oracle Big Data Discovery is a set of end-to-end visual analytic capabilities that leverage the power of Hadoop to transform raw data into business insight in minutes, without the need to learn complex products or rely only on highly skilled resources.
