


by Kurt Wolff
An OBIEE dashboard designer recently asked how to turn a prompt for a single month into a filter for a range of months. For...

by Kurt Wolff
An OBIEE dashboard designer recently asked how to turn a prompt for a single month into a filter for a range of months. For example, if the user selects “Aug” in the prompt, the results should include not just August but also the three months preceding and following August (i.e. May through Nov).
by Kurt Wolff
One of the tricky things for users of relational databases is forming queries without overstating (or understating) results...
by Kurt Wolff
One of the tricky things for users of relational databases is forming queries without overstating (or understating) results as a consequence of table joins.

On January 10th, KPI Partners broadcast a webinar which took a deep dive into their exclusive pre-built solution for Manufacturing...
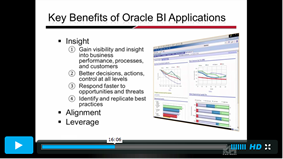
On January 10th, KPI Partners broadcast a webinar which took a deep dive into their exclusive pre-built solution for Manufacturing Analytics. Pavan Nanjundaiah, KPI's resident expert on the subject, demonstrated how this solution can help existing customers of Oracle BI Applications further extend their decision support capability.
by Kurt Wolff
Linear regression is a statistical technique for drawing a line through a set of data points that “best fits” the data. It...
by Kurt Wolff
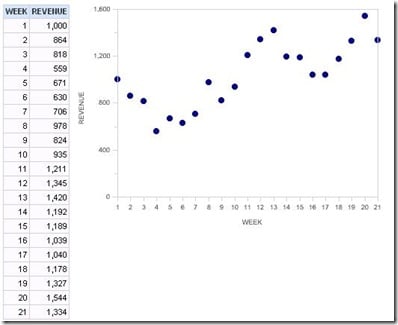
Linear regression is a statistical technique for drawing a line through a set of data points that “best fits” the data. It is a useful and standard technique for quantifying trends.
The experts at KPI Partners have completed a marathon schedule of webinars from the end of October through December. In the event you...
The experts at KPI Partners have completed a marathon schedule of webinars from the end of October through December. In the event you missed an event, a recording from each of the webinars have been posted to the KPI Partners webinar archive.
by Kurt Wolff
One of the questions that comes up over and over again is how to show all periods in a query when facts don’t exist for all...
by Kurt Wolff
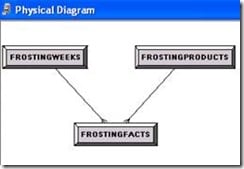
One of the questions that comes up over and over again is how to show all periods in a query when facts don’t exist for all periods or how to show all products when facts don’t exist for all products.
by Kurt Wolff
[Note: the following discussion is based on OBIEE version 10.1.3.4.0 and Oracle XE version 10G, both running on Windows. The...
by Kurt Wolff
[Note: the following discussion is based on OBIEE version 10.1.3.4.0 and Oracle XE version 10G, both running on Windows. The behavior of other versions of OBIEE could be different.]
by Kurt Wolff
Here’s a not uncommon scenario. You are designing a dashboard page with a report such as sales by customer. To show sales by...
by Kurt Wolff
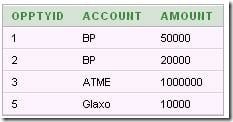
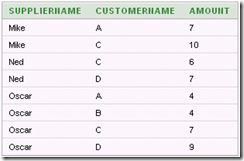
Here’s a not uncommon scenario. You are designing a dashboard page with a report such as sales by customer. To show sales by customer, you design a report containing the CustomerName column so that facts are grouped by customer. You provide a multi-select prompt to allow the user to select which customer data to view. But you also want to provide the ability to view the data for all customers as a total, without grouping by customer.

KPI Partners has developed a pre-built analytic application specifically designed for manufacturing and costing processes.
Minneapolis,...
KPI Partners has developed a pre-built analytic application specifically designed for manufacturing and costing processes.
Minneapolis, Minnesota – November 17, 2011 -- KPI Partners today announced the introduction of Manufacturing Analytics for Oracle BI, a solution developed for use with the Oracle Business Intelligence platform and the Oracle E-Business Suite Manufacturing modules. KPI’s Manufacturing Analytics enable any organization to monitor and analyze the manufacturing processes and costing details that exist within an organization.
by Kurt Wolff
Here is a technique for enabling the user to set join columns with a dashboard prompt.
by Kurt Wolff
Here is a technique for enabling the user to set join columns with a dashboard prompt.


by Kurt Wolff
An OBIEE dashboard designer recently asked how to turn a prompt for a single month into a filter for a range of months. For example, if the user selects “Aug” in the prompt, the results should include not just August but also the three months preceding and following August (i.e. May through Nov).
by Kurt Wolff
One of the tricky things for users of relational databases is forming queries without overstating (or understating) results as a consequence of table joins.
On January 10th, KPI Partners broadcast a webinar which took a deep dive into their exclusive pre-built solution for Manufacturing Analytics. Pavan Nanjundaiah, KPI's resident expert on the subject, demonstrated how this solution can help existing customers of Oracle BI Applications further extend their decision support capability.
by Kurt Wolff
Linear regression is a statistical technique for drawing a line through a set of data points that “best fits” the data. It is a useful and standard technique for quantifying trends.
The experts at KPI Partners have completed a marathon schedule of webinars from the end of October through December. In the event you missed an event, a recording from each of the webinars have been posted to the KPI Partners webinar archive.
by Kurt Wolff
One of the questions that comes up over and over again is how to show all periods in a query when facts don’t exist for all periods or how to show all products when facts don’t exist for all products.
by Kurt Wolff
[Note: the following discussion is based on OBIEE version 10.1.3.4.0 and Oracle XE version 10G, both running on Windows. The behavior of other versions of OBIEE could be different.]
by Kurt Wolff
Here’s a not uncommon scenario. You are designing a dashboard page with a report such as sales by customer. To show sales by customer, you design a report containing the CustomerName column so that facts are grouped by customer. You provide a multi-select prompt to allow the user to select which customer data to view. But you also want to provide the ability to view the data for all customers as a total, without grouping by customer.
KPI Partners has developed a pre-built analytic application specifically designed for manufacturing and costing processes.
Minneapolis, Minnesota – November 17, 2011 -- KPI Partners today announced the introduction of Manufacturing Analytics for Oracle BI, a solution developed for use with the Oracle Business Intelligence platform and the Oracle E-Business Suite Manufacturing modules. KPI’s Manufacturing Analytics enable any organization to monitor and analyze the manufacturing processes and costing details that exist within an organization.
by Kurt Wolff
Here is a technique for enabling the user to set join columns with a dashboard prompt.
