

by Kurt Wolff
Here is a technique for enabling the user to set join columns with a dashboard prompt.

by Kurt Wolff
Here is a technique for enabling the user to set join columns with a dashboard prompt.
by Kurt Wolff
The Ago() “time series function” can be used to show data for a previous time period, as long as the previous time period...
by Kurt Wolff
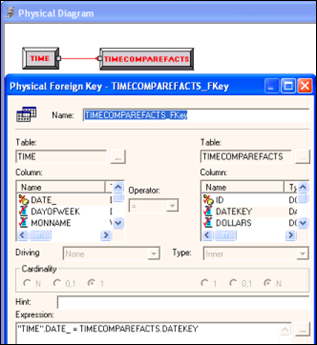
The Ago() “time series function” can be used to show data for a previous time period, as long as the previous time period corresponds to a level that has been defined in the period hierarchy. A typical period hierarchy containing day, month, quarter, and year levels would allow you to use the Ago function to construct measures showing data for day ago, month ago, quarter ago, year ago (or N days ago, N months ago, etc.).
by Kurt Wolff
Someone asked a question on a “Siebel Analytics” email group a few days ago that I thought was worth discussing briefly...
by Kurt Wolff
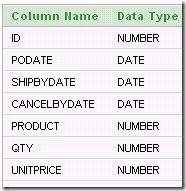
Someone asked a question on a “Siebel Analytics” email group a few days ago that I thought was worth discussing briefly here. The question posed was how to put a date prompt on a dashboard and return data for that date and the next 30 days. The solution could not involve presentation or report variables, since these were introduced only in a later version of Siebel Analytics that the person who posed the question did not have.
by Kurt Wolff
There are times when you might want to visually present data directly in tables or pivot tables rather than create a chart...
by Kurt Wolff
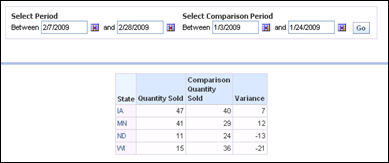
There are times when you might want to visually present data directly in tables or pivot tables rather than create a chart view. For example, you may have too many values to show in a chart. Or the number of values returned by the query might vary, making the size of the chart sometimes too small to accommodate them all, sometimes too large. Or you may want to visually scroll up and down a table to compare values and would like a visual representation right there in the table.
The team of Sid Goel, Kusal Swarnakar, and Sid Singh collaborated on a webinar last week that covered the much misunderstood subject of...
by Kurt Wolff
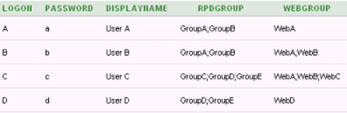
I thought it would be worth exploring the interrelated topics of repository groups, web groups, system session variables,...
by Kurt Wolff
I thought it would be worth exploring the interrelated topics of repository groups, web groups, system session variables, Delivers, the SA System subject area, and My Account.

| 2011 KPI Napa Valley Wine Tour |
On Sunday of Oracle OpenWorld week, guests joined KPI Partners on an exclusive full day winery...
| 2011 KPI Napa Valley Wine Tour |
On Sunday of Oracle OpenWorld week, guests joined KPI Partners on an exclusive full day winery tour through Napa Valley. Participants were transported via executive limo bus from San Francisco, provided tours of 3 Napa Valley wineries, and experienced a four-course lunch overlooking the hills of Napa.

| 2011 KPI Partners Happy Hour at Oracle OpenWorld |
On Monday evening, all clients, partners, prospects, and friends were invited to...
| 2011 KPI Partners Happy Hour at Oracle OpenWorld |
On Monday evening, all clients, partners, prospects, and friends were invited to join us for good times, good music, complimentary cocktails and appetizers inside the Roundabout Theater @ Zeum.
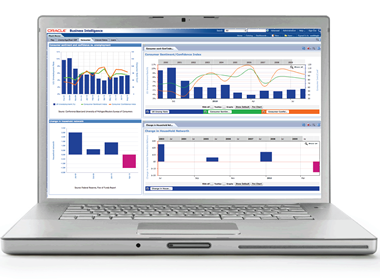
Award Winning Business Intelligence Applications Solution Realized an ROI of $500 Thousand In The First Week
ORACLE OPENWORLD, San...
Award Winning Business Intelligence Applications Solution Realized an ROI of $500 Thousand In The First Week
ORACLE OPENWORLD, San Francisco, CA – October 3, 2011 – KPI Partners, a member of the Oracle® PartnerNetwork, is honored to be selected as Oracle’s 2011 recipient of the North America Titan Award in the ‘Business Intelligence Application Solution’ category. The awards are presented on Tuesday, October 4th during the Oracle North America Partner & Titan Award Gala held at San Francisco’s City Hall.
KPI Partners has developed a pre-built analytic application specifically designed for standard repair processes.
San Francisco, California...
KPI Partners has developed a pre-built analytic application specifically designed for standard repair processes.
San Francisco, California – October 2, 2011 -- KPI Partners today announced the introduction of Depot Repair Analytics for Oracle Business Intelligence, a solution developed for use with the Oracle Business Intelligence platform and the Oracle E-Business Suite Depot Repair module. KPI’s Depot Repair Analytics enable any organization to monitor and report on repair processes throughout the entire life cycle. Key analytical areas include Repair Orders, Estimates, and Shipping & Billing.


by Kurt Wolff
Here is a technique for enabling the user to set join columns with a dashboard prompt.
by Kurt Wolff
The Ago() “time series function” can be used to show data for a previous time period, as long as the previous time period corresponds to a level that has been defined in the period hierarchy. A typical period hierarchy containing day, month, quarter, and year levels would allow you to use the Ago function to construct measures showing data for day ago, month ago, quarter ago, year ago (or N days ago, N months ago, etc.).
by Kurt Wolff
Someone asked a question on a “Siebel Analytics” email group a few days ago that I thought was worth discussing briefly here. The question posed was how to put a date prompt on a dashboard and return data for that date and the next 30 days. The solution could not involve presentation or report variables, since these were introduced only in a later version of Siebel Analytics that the person who posed the question did not have.
by Kurt Wolff
There are times when you might want to visually present data directly in tables or pivot tables rather than create a chart view. For example, you may have too many values to show in a chart. Or the number of values returned by the query might vary, making the size of the chart sometimes too small to accommodate them all, sometimes too large. Or you may want to visually scroll up and down a table to compare values and would like a visual representation right there in the table.
by Kurt Wolff
I thought it would be worth exploring the interrelated topics of repository groups, web groups, system session variables, Delivers, the SA System subject area, and My Account.
| 2011 KPI Napa Valley Wine Tour |
On Sunday of Oracle OpenWorld week, guests joined KPI Partners on an exclusive full day winery tour through Napa Valley. Participants were transported via executive limo bus from San Francisco, provided tours of 3 Napa Valley wineries, and experienced a four-course lunch overlooking the hills of Napa.
| 2011 KPI Partners Happy Hour at Oracle OpenWorld |
On Monday evening, all clients, partners, prospects, and friends were invited to join us for good times, good music, complimentary cocktails and appetizers inside the Roundabout Theater @ Zeum.
Award Winning Business Intelligence Applications Solution Realized an ROI of $500 Thousand In The First Week
ORACLE OPENWORLD, San Francisco, CA – October 3, 2011 – KPI Partners, a member of the Oracle® PartnerNetwork, is honored to be selected as Oracle’s 2011 recipient of the North America Titan Award in the ‘Business Intelligence Application Solution’ category. The awards are presented on Tuesday, October 4th during the Oracle North America Partner & Titan Award Gala held at San Francisco’s City Hall.
KPI Partners has developed a pre-built analytic application specifically designed for standard repair processes.
San Francisco, California – October 2, 2011 -- KPI Partners today announced the introduction of Depot Repair Analytics for Oracle Business Intelligence, a solution developed for use with the Oracle Business Intelligence platform and the Oracle E-Business Suite Depot Repair module. KPI’s Depot Repair Analytics enable any organization to monitor and report on repair processes throughout the entire life cycle. Key analytical areas include Repair Orders, Estimates, and Shipping & Billing.
