

By Harisha Pattela
To install and configure BI Composer for Oracle BI EE, use the following steps as a guide:
Step 1
Extend a Web Logic...

By Harisha Pattela
To install and configure BI Composer for Oracle BI EE, use the following steps as a guide:
Step 1
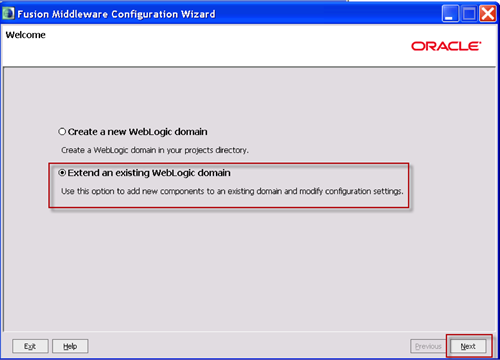
Extend a Web Logic Server domain & to install BI Composer runtime implementation shared libraries:
- Stop the Web Logic Server.
- Launch the Configuration Wizard.
- Select Extend an existing Weblogic domain, and then click Next.
- Select the domain folder (for example, <mw_home>/user_projects/domains/bifoundation_domain), and then click Next.
By Kurt Wolff
When I read the questions people ask about data modeling on OBIEE forums, one that seems to come up frequently is what to do...
By Kurt Wolff
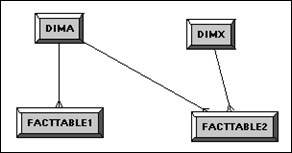
When I read the questions people ask about data modeling on OBIEE forums, one that seems to come up frequently is what to do when you have fact tables that do not join to all dimension tables.
By Kurt Wolff
“Writeback” – presenting an Answers interface so that users can update data in database tables or insert new rows – first...
By Kurt Wolff
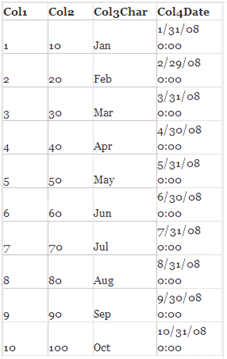
“Writeback” – presenting an Answers interface so that users can update data in database tables or insert new rows – first appeared in version 7.8.4. To use OBIEE’s writeback capabilities, there are several set up steps. While each one is simple and fairly straightforward, it’s easy to forget all the steps and where each one is located. This document contains the instructions in case you find yourself forgetting them. Since many people like to demo using Excel as a data source, it focuses first on using Excel. Later, an example using an Oracle table is discussed.
By Kurt Wolff
It is often convenient to set a number of session variables to capture date values that you use repeatedly in your queries....
By Kurt Wolff
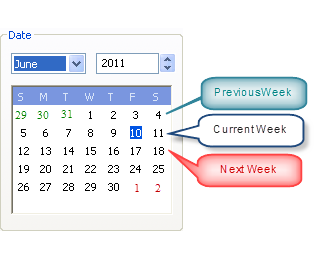
It is often convenient to set a number of session variables to capture date values that you use repeatedly in your queries. For example, if you have weeks that end on Saturday, you might want to have the date of the most recent Saturday in a session variable, called perhaps PREVIOUSSATURDAY. You can then use that session variable as the default date value in your queries – for example, “Periods”.”Date” = VALUEOF(NQ_SESSION.PREVIOUSSATURDAY).
By Kurt Wolff
This post shows how you can use presentation variables to select a single value in a dashboard prompt and produce a result...
By Kurt Wolff
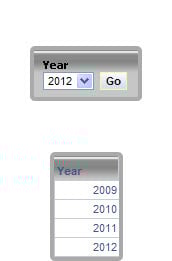
This post shows how you can use presentation variables to select a single value in a dashboard prompt and produce a result set that includes a range of values. For example, you could select a single year in a prompt and show data for that year and the preceding three years
By Kurt Wolff
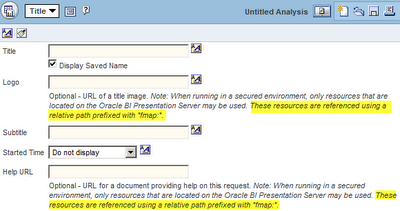
The OBIEE Answers (10g) user interface says to use "fmap" when referring to resources on the presentation server.
By Kurt Wolff
The OBIEE Answers (10g) user interface says to use "fmap" when referring to resources on the presentation server.

By Kurt Wolff
There are many times when it is very beneficial to pass the value of session variables (or report variables) into the SQL...
By Kurt Wolff
There are many times when it is very beneficial to pass the value of session variables (or report variables) into the SQL used to define a Select table in the physical layer. This allows the select statement to focus on just the data you want, rather than creating a view with potentially millions of rows and then subsequently applying a filter to that result set.
By Kurt Wolff
A common question is whether OBIEE can display a table and freeze the header “like you can in Excel”. OBIEE does not offer...
By Kurt Wolff
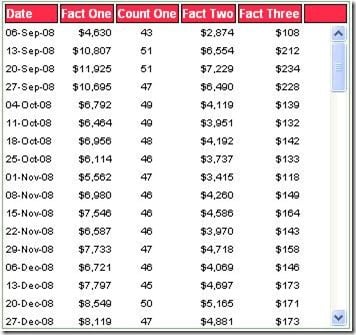
A common question is whether OBIEE can display a table and freeze the header “like you can in Excel”. OBIEE does not offer that feature out of the box, but you can do this (more or less) with the narrative view and the appropriate html.
By Kurt Wolff
In addition to familiar SQL aggregation functions such as Sum, Max, Min, Average, and Count, OBIEE also supports an...
By Kurt Wolff
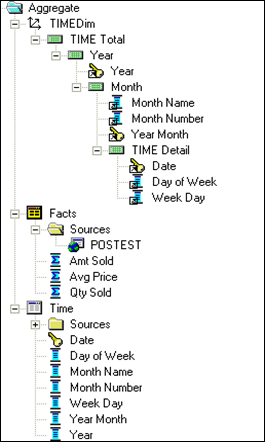
In addition to familiar SQL aggregation functions such as Sum, Max, Min, Average, and Count, OBIEE also supports an aggregation function called “Aggregate”. This function is available for use in formulas written in Answers.
By Kurt Wolff
What is the formula behind a measure? What is the source of the column in the report? These kinds of questions could be...
By Kurt Wolff
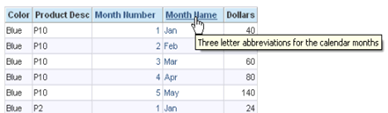
What is the formula behind a measure? What is the source of the column in the report? These kinds of questions could be handled in multiple ways. The data dictionary feature is one, although a common reaction to the data dictionary feature is that it’s more suited to IT than to the business users. Another way is to present a “tool tip” in Answers (the text of which comes from the Description property of the logical or presentation column in the metadata). However, many users do not have access to Answers or mainly encounter the columns while perusing reports in a dashboard.


By Harisha Pattela
To install and configure BI Composer for Oracle BI EE, use the following steps as a guide:
Step 1
Extend a Web Logic Server domain & to install BI Composer runtime implementation shared libraries:
- Stop the Web Logic Server.
- Launch the Configuration Wizard.
- Select Extend an existing Weblogic domain, and then click Next.
- Select the domain folder (for example, <mw_home>/user_projects/domains/bifoundation_domain), and then click Next.
By Kurt Wolff
When I read the questions people ask about data modeling on OBIEE forums, one that seems to come up frequently is what to do when you have fact tables that do not join to all dimension tables.
By Kurt Wolff
“Writeback” – presenting an Answers interface so that users can update data in database tables or insert new rows – first appeared in version 7.8.4. To use OBIEE’s writeback capabilities, there are several set up steps. While each one is simple and fairly straightforward, it’s easy to forget all the steps and where each one is located. This document contains the instructions in case you find yourself forgetting them. Since many people like to demo using Excel as a data source, it focuses first on using Excel. Later, an example using an Oracle table is discussed.
By Kurt Wolff
It is often convenient to set a number of session variables to capture date values that you use repeatedly in your queries. For example, if you have weeks that end on Saturday, you might want to have the date of the most recent Saturday in a session variable, called perhaps PREVIOUSSATURDAY. You can then use that session variable as the default date value in your queries – for example, “Periods”.”Date” = VALUEOF(NQ_SESSION.PREVIOUSSATURDAY).
By Kurt Wolff
This post shows how you can use presentation variables to select a single value in a dashboard prompt and produce a result set that includes a range of values. For example, you could select a single year in a prompt and show data for that year and the preceding three years
By Kurt Wolff
The OBIEE Answers (10g) user interface says to use "fmap" when referring to resources on the presentation server.
By Kurt Wolff
There are many times when it is very beneficial to pass the value of session variables (or report variables) into the SQL used to define a Select table in the physical layer. This allows the select statement to focus on just the data you want, rather than creating a view with potentially millions of rows and then subsequently applying a filter to that result set.
By Kurt Wolff
A common question is whether OBIEE can display a table and freeze the header “like you can in Excel”. OBIEE does not offer that feature out of the box, but you can do this (more or less) with the narrative view and the appropriate html.
By Kurt Wolff
In addition to familiar SQL aggregation functions such as Sum, Max, Min, Average, and Count, OBIEE also supports an aggregation function called “Aggregate”. This function is available for use in formulas written in Answers.
By Kurt Wolff
What is the formula behind a measure? What is the source of the column in the report? These kinds of questions could be handled in multiple ways. The data dictionary feature is one, although a common reaction to the data dictionary feature is that it’s more suited to IT than to the business users. Another way is to present a “tool tip” in Answers (the text of which comes from the Description property of the logical or presentation column in the metadata). However, many users do not have access to Answers or mainly encounter the columns while perusing reports in a dashboard.
