

By Kurt Wolff
A common question is whether OBIEE can display a table and freeze the header “like you can in Excel”. OBIEE does not offer...

By Kurt Wolff
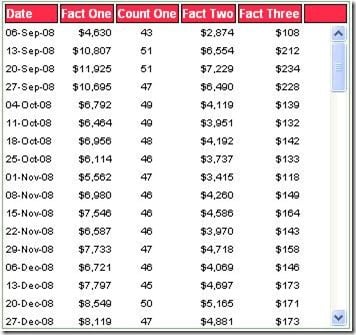
A common question is whether OBIEE can display a table and freeze the header “like you can in Excel”. OBIEE does not offer that feature out of the box, but you can do this (more or less) with the narrative view and the appropriate html.
By Kurt Wolff
In addition to familiar SQL aggregation functions such as Sum, Max, Min, Average, and Count, OBIEE also supports an...
By Kurt Wolff
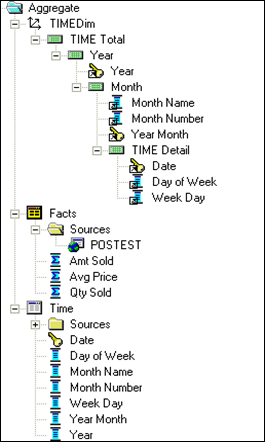
In addition to familiar SQL aggregation functions such as Sum, Max, Min, Average, and Count, OBIEE also supports an aggregation function called “Aggregate”. This function is available for use in formulas written in Answers.
By Kurt Wolff
What is the formula behind a measure? What is the source of the column in the report? These kinds of questions could be...
By Kurt Wolff
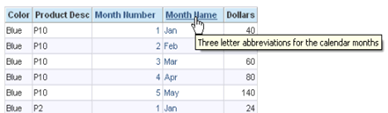
What is the formula behind a measure? What is the source of the column in the report? These kinds of questions could be handled in multiple ways. The data dictionary feature is one, although a common reaction to the data dictionary feature is that it’s more suited to IT than to the business users. Another way is to present a “tool tip” in Answers (the text of which comes from the Description property of the logical or presentation column in the metadata). However, many users do not have access to Answers or mainly encounter the columns while perusing reports in a dashboard.


By Kurt Wolff
A common question is whether OBIEE can display a table and freeze the header “like you can in Excel”. OBIEE does not offer that feature out of the box, but you can do this (more or less) with the narrative view and the appropriate html.
By Kurt Wolff
In addition to familiar SQL aggregation functions such as Sum, Max, Min, Average, and Count, OBIEE also supports an aggregation function called “Aggregate”. This function is available for use in formulas written in Answers.
By Kurt Wolff
What is the formula behind a measure? What is the source of the column in the report? These kinds of questions could be handled in multiple ways. The data dictionary feature is one, although a common reaction to the data dictionary feature is that it’s more suited to IT than to the business users. Another way is to present a “tool tip” in Answers (the text of which comes from the Description property of the logical or presentation column in the metadata). However, many users do not have access to Answers or mainly encounter the columns while perusing reports in a dashboard.
