

by Kurt Wolff
Suppose you have a series of datetime pairs in Oracle BI... The problem is to display the differences between DATE1 and...

by Kurt Wolff
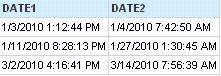
Suppose you have a series of datetime pairs in Oracle BI... The problem is to display the differences between DATE1 and DATE2 in days, hours, minutes, and seconds.

by Kurt Wolff
When you duplicate a table, you create a new physical table with a new name. If this table is involved in a query, the SQL...
by Kurt Wolff
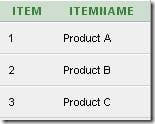
When you duplicate a table, you create a new physical table with a new name. If this table is involved in a query, the SQL FROM clause will list this table. If the table does not exist in the database, then an error will occur.
Creating an alias creates a copy of the metadata table object that will be referenced in SQL with a new alias name. The alias name in SQL, as it is for all tables, will be derived its metadata ID.
To see the table IDs in OBIEE metadata, use the Oracle BI Query Repository utility. Here are some physical tables (and aliases) in a repository that I’ve created. It’s the last five digits of the ID that will be used to create the table aliases in SQL.
by Kurt Wolff
Row level security (constraining a user’s view of the data to rows which meet pre-defined criteria) is a common requirement...
by Kurt Wolff
Row level security (constraining a user’s view of the data to rows which meet pre-defined criteria) is a common requirement in OBIEE. This post will explore this topic, using a simple schema with a single fact table and three dimension tables, built around the theme of retail sales.
by Kurt Wolff
Suppose you have a dashboard with three pages (tabs). Suppose further that not every user should see all three tabs. Most...
by Kurt Wolff
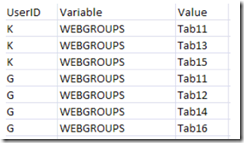
Suppose you have a dashboard with three pages (tabs). Suppose further that not every user should see all three tabs. Most users will see a limited set of the tabs – some will see two, some will see only one. You want to define web groups to cover all the possible combinations. How many web groups would you have to create?
What is Business Intelligence? Listen to a brief history of BI, where we've been, where we are now, and where we are going...
What is Business Intelligence? Listen to a brief history of BI, where we've been, where we are now, and where we are going...

by Kurt Wolff
If you have tried to develop dashboards or coherent sets of reports as an analytic application, you have had to think about...
by Kurt Wolff
If you have tried to develop dashboards or coherent sets of reports as an analytic application, you have had to think about how best to structure a web catalog.
Don't let the name fool you. Lightweight Directory Access Protocol (LDAP) is no lightweight.
Don't let the name fool you. Lightweight Directory Access Protocol (LDAP) is no lightweight.
KPI Partners Founder, Sid Goel, was recently quoted in a recent article regarding the release of Oracle Exalytics:
KPI Partners Founder, Sid Goel, was recently quoted in a recent article regarding the release of Oracle Exalytics:
by Kurt Wolff
Stephen Few designed the Bullet Graph as a way to display measurements vs. goals or other benchmarks. The screen shot below...
by Kurt Wolff
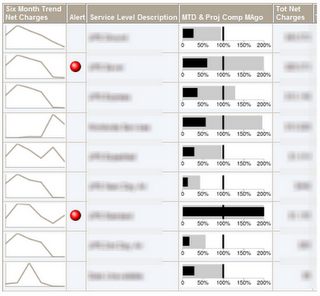
Stephen Few designed the Bullet Graph as a way to display measurements vs. goals or other benchmarks. The screen shot below shows bullet charts in the column “MTD & Proj Comp MAgo” (Month to Date and Projected Expense Compared to Month Ago).

by Kurt Wolff
An OBIEE dashboard designer recently asked how to turn a prompt for a single month into a filter for a range of months. For...
by Kurt Wolff
An OBIEE dashboard designer recently asked how to turn a prompt for a single month into a filter for a range of months. For example, if the user selects “Aug” in the prompt, the results should include not just August but also the three months preceding and following August (i.e. May through Nov).


by Kurt Wolff
Suppose you have a series of datetime pairs in Oracle BI... The problem is to display the differences between DATE1 and DATE2 in days, hours, minutes, and seconds.
by Kurt Wolff
When you duplicate a table, you create a new physical table with a new name. If this table is involved in a query, the SQL FROM clause will list this table. If the table does not exist in the database, then an error will occur.
Creating an alias creates a copy of the metadata table object that will be referenced in SQL with a new alias name. The alias name in SQL, as it is for all tables, will be derived its metadata ID.
To see the table IDs in OBIEE metadata, use the Oracle BI Query Repository utility. Here are some physical tables (and aliases) in a repository that I’ve created. It’s the last five digits of the ID that will be used to create the table aliases in SQL.
by Kurt Wolff
Row level security (constraining a user’s view of the data to rows which meet pre-defined criteria) is a common requirement in OBIEE. This post will explore this topic, using a simple schema with a single fact table and three dimension tables, built around the theme of retail sales.
by Kurt Wolff
Suppose you have a dashboard with three pages (tabs). Suppose further that not every user should see all three tabs. Most users will see a limited set of the tabs – some will see two, some will see only one. You want to define web groups to cover all the possible combinations. How many web groups would you have to create?
What is Business Intelligence? Listen to a brief history of BI, where we've been, where we are now, and where we are going...
by Kurt Wolff
If you have tried to develop dashboards or coherent sets of reports as an analytic application, you have had to think about how best to structure a web catalog.
Don't let the name fool you. Lightweight Directory Access Protocol (LDAP) is no lightweight.
KPI Partners Founder, Sid Goel, was recently quoted in a recent article regarding the release of Oracle Exalytics:
by Kurt Wolff
Stephen Few designed the Bullet Graph as a way to display measurements vs. goals or other benchmarks. The screen shot below shows bullet charts in the column “MTD & Proj Comp MAgo” (Month to Date and Projected Expense Compared to Month Ago).
by Kurt Wolff
An OBIEE dashboard designer recently asked how to turn a prompt for a single month into a filter for a range of months. For example, if the user selects “Aug” in the prompt, the results should include not just August but also the three months preceding and following August (i.e. May through Nov).
