KPI Partners Blog

Azure Analysis Services with Power BI - Best Practices

Posted by KPI Partners News Team on Mon, Aug 24, 2020 @ 07:43 AM

by Chandra Matam

Azure Analysis Services with Power BI - Best Practices

Power BI Overview

Power BI is a business analytics solution that lets you visualize your data and share insights across your organization or embed them in your app or website. Connect to a wide variety of data sources and bring your data to life with live dashboards and reports.

Read More

Tags: Blog, Power BI, Power BI Blog Series, Microsoft Azure, Azure Analysis Services

Azure Power BI Automation - DataSets

Posted by KPI Partners News Team on Wed, Aug 12, 2020 @ 03:41 PM

by Madan Thota

Azure Power BI Automation - DataSets

This is the fifth post in KPI's Power BI blog series. In this blog, we provide a high-level overview of dataset refresh and other dataset operations from PowerShell. You can read the other posts in the series here:

  1. Visual Interactivity in a Power BI Report
  2. Dynamic Selection of Measures in Power BI
  3. Security and Collaboration in Power BI
  4. What is PowerShell and Connect to Power BI Service

Read More

Tags: Madan Thota, Blog, Power BI, Power BI Blog Series, Azure Power BI Automation, 2 DataSets

Azure Power BI Automation - 1 Basics and Connect

Posted by KPI Partners News Team on Wed, Aug 12, 2020 @ 03:41 PM

by Madan Thota

Azure Power BI Automation - Basics and Connect

This is the forth post in KPI's Power BI blog series. In this blog, we provide a high-level overview of PowerShell and how to connect it to the Power BI service. You can read the other posts in the series here:

Read More

Tags: Madan Thota, Blog, Power BI, Power BI Blog Series, Azure Power BI Automation, Basics and Connect

Security and Collaboration in Power BI

Posted by KPI Partners News Team on Wed, Aug 29, 2018 @ 02:11 PM

by Ranjeet Mandal

Security and Collaboration in Power BI

This is the third post in KPI's Power BI blog series. In this blog, we will cover security and collaboration in Power BI. You can read the other posts in the series here:

  1. Visual Interactivity in a Power BI Report
  2. Dynamic Selection of Measures in Power BI
  3. What is PowerShell and Connect to Power BI Service
  4. Dataset refresh and other dataset operations from PowerShell

Data Security

Row level data security in Power BI can be implemented by creating multiple roles and rules within Power BI desktop. Users need to be assigned to different roles in Power BI Service.

Read More

Tags: Blog, Power BI, Power BI Blog Series, Ranjeet Mandal, Security and Collaboration

Dynamic Selection of Measures in Power BI

Posted by KPI Partners News Team on Fri, Aug 24, 2018 @ 02:48 PM

by Ranjeet Mandal

Dynamic Selection of Measures in Power BI

This is the second post in KPI's Power BI blog series. In this blog, we will discuss the dynamic selection of measures in Power BIYou can read the other posts in the series here:

  1. Visual Interactivity in a Power BI Report
  2. Security and Collaboration in Power BI
  3. What is PowerShell and Connect to Power BI Service
  4. Dataset refresh and other dataset operations from PowerShell

Have you ever needed to use slicers in Power BI to choose a measure to be displayed in your charts? We know that the default functionality of Power BI slicers is to allow us to choose from the available dimension or measure values. But what about the ability to choose which measure to be displayed?

Read More

Tags: Blog, Power BI, Power BI Blog Series, Ranjeet Mandal, Dynamic Selection

Visual Interactivity in a Power BI Report

Posted by KPI Partners News Team on Fri, Aug 17, 2018 @ 01:24 PM

by Ranjeet Mandal

Visual Interactivity in a Power BI Report

This is the first post in KPI's Power BI blog series. In this blog, we provide a high-level overview on visual interactivity in a Power BI report. You can read the other posts in the series here:

  1. Dynamic Selection of Measures in Power BI
  2. Security and Collaboration in Power BI
  3. What is PowerShell and Connect to Power BI Service
  4. Dataset refresh and other dataset operations from PowerShell

Power BI visuals in a report page are interactive among each other, by default. An item selection in a visual impacts the rest of the visuals by highlighting the related items. However, do we get the required clarity in visualization? What if we need to display Totals, which should not be impacted by selection in any other visual?

Read More

Tags: Blog, Data Visualization, Power BI, Power BI Blog Series, Ranjeet Mandal

Google Data Studio - Initial Impressions

Posted by KPI Partners News Team on Fri, Oct 06, 2017 @ 11:54 AM

by Rushendra Prasad

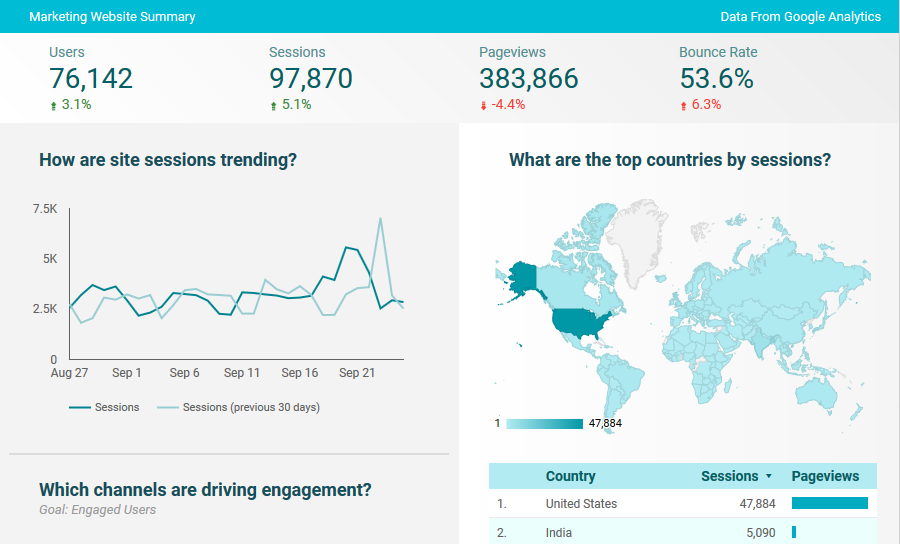
This blog post offers an insight into the features and functionalities of Google Data Studio and compares it with popular data analysis tools like Tableau, QlikView and new entrants like Power BI.

Disclaimer: This article and all features assessed are as on Sep, 2017 and subject to modifications / enhancements by Google.
Read More

Tags: OBIEE, Rushendra Prasad, Tableau, Blog, Power BI, Google Data Studio